A new study used machine learning to analyze 600 years of painting in an effort to enhance established economic data.
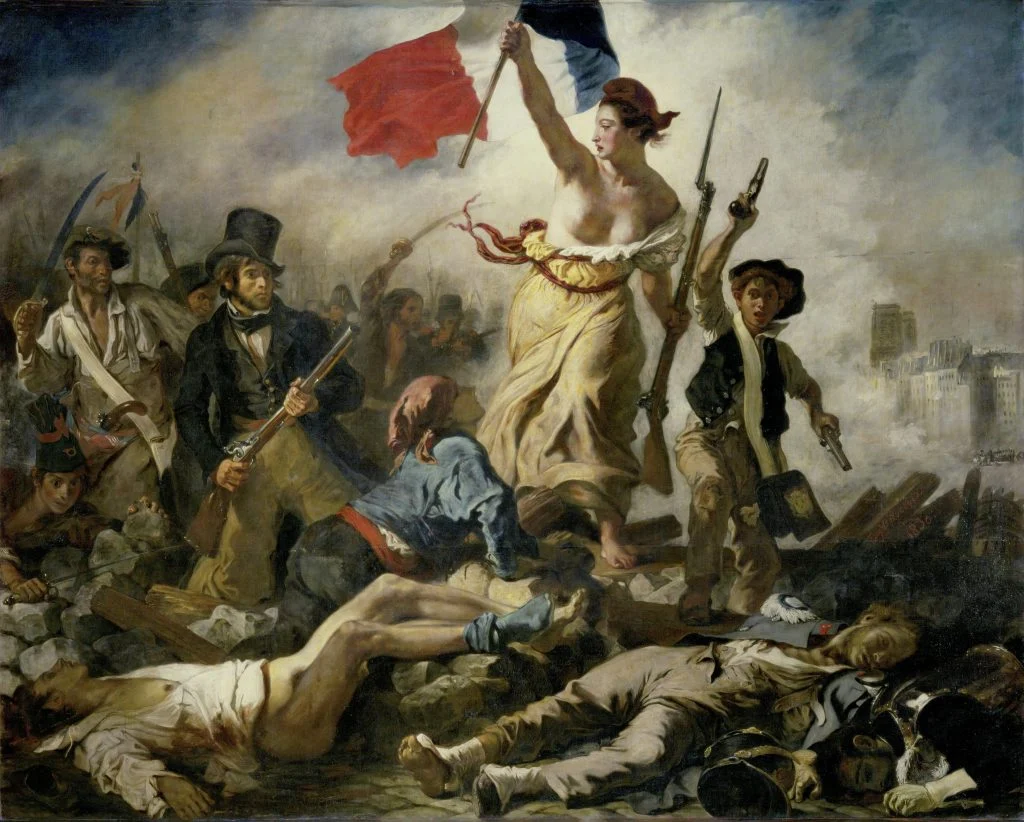
Two well-known paintings about war—Delacroix’s triumphant Liberty Leading the People (1830) and Picasso’s darkly chaotic Guernica (1937)—use distinct styles and compositional arrangements to amplify a certain mood, reflecting a wider set of social norms, beliefs, or aspirations. Typically art historians interpret paintings like these to help us understand the context in which they were made. In a new study, however, the task has been taken up by a team of economists.
By training artificial intelligence to detect emotional signals in more than 600,000 European paintings spanning 600 years, the researchers found that collective shifts in artistic mood often aligned with historical moments of prosperity, hardship, or upheaval, from the rise of trade networks to the disruptions of new technologies. While the method has its limits, the findings add valuable texture to economic data.
In their paper, “State of the Art: Economic Development through the Lens of Paintings,” published by the National Bureau of Economic Research, the researchers argue that historical paintings can serve as valuable sources of information about societal moods and structural shifts, especially in periods where traditional economic and social data is scarce. By “reversing the creative process,” the study treats paintings not only as unique artistic expressions but also as collective reflections of the environments and conditions that shaped them.

William-Adolphe Bouguereau’s French washerwoman (1855) depicts a woman carrying a basket of clothes while other woman scrub their whites by a stream. Photo: Buyenlarge/Getty Images.
While this may seem self evident to students and scholars of the humanities, the authors noted that “paintings capture dimensions of historical experience typically absent from standard data sources.” For instance, artists working in the same time and place might have very different interpretations of their environment. They give the example of 19th-century French painters Gustave Courbet and William-Adolphe Bouguereau, both of whom worked in the style of Realism. The former presented a rougher, more realistic image of rural life compared to the latter’s pastoral idealization, but the emotions identified in each of their works offers a “higher-frequency view of living standards and cultural sentiment across European societies.”
Though not art historians themselves, the researchers said that their procedure to quantify the meaning of art is “closely related to the emerging field of digital art history, which explores how quantitative and computational techniques can enrich traditional art-historical inquiry.”
Controlling for variation in artist, genre, or era-specific influences, the economists trained an A.I. to predict nine emotions, including sadness, fear, anger, awe, contentment, and amusement in over 630,000 paintings. This dataset, sourced from Google Arts and Culture, Wiki-Data, and Wiki-Art, featured predominantly traditional, figurative European painting of all genres from 1400 up to 2000. The researchers acknowledged this sample’s limitations in skewing heavily in favor of Western artists who have been collected, curated, and canonized, leaving out vast swathes of marginalized artistic production. Yanos Zylberberg, an economics professor at Bristol University and one of the three co-authors of the paper, said they hope to be able to work with an expanded dataset in the future.
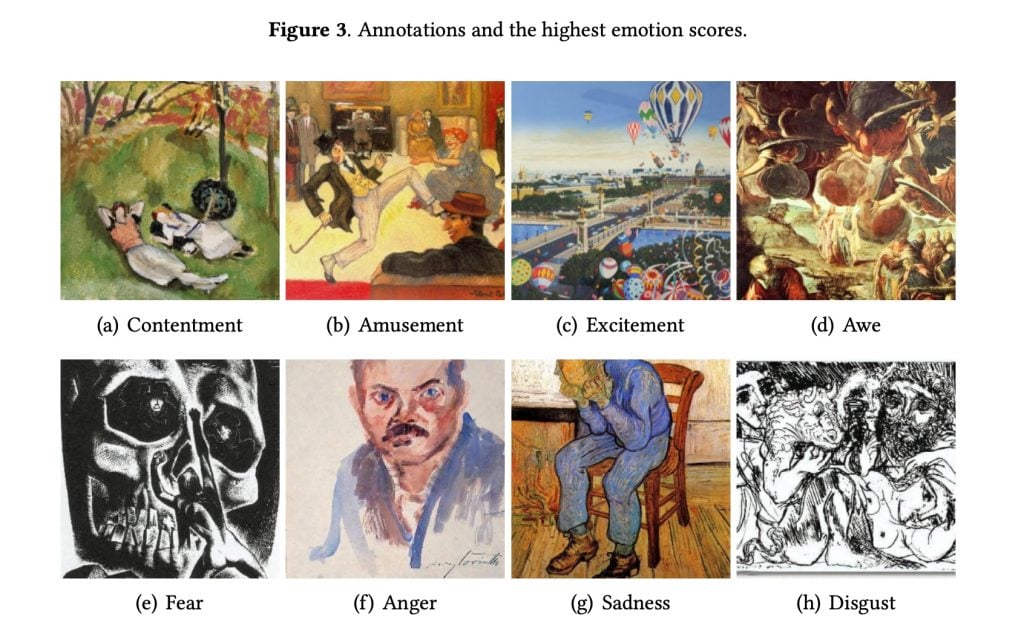
This figure shows the paintings with the highest emotion scores among 79,860 annotated artworks, by emotion (amusement, anger, awe, contentment, disgust, excitement, fear, sadness, and other—not shown).
In the training process, the A.I.’s accuracy was measured against emotional labels that had been provided by some 15 to 25 human annotators from different regions and backgrounds, a number intended to offset the effect of differing personal interpretations in favor of a “wisdom-of-the-crowd effect.” The researchers admitted that the model may nonetheless have adopted some biases from this process, such as that non-European annotators tended to read contentment in the paintings more than excitement or amusement, in comparison to their European counterparts, while nudity tended to “evoke disgust” in some cases.
A particular painting’s primary emotion might reflect either the innate mindset of the artist or the prevailing mood of their era, but the researchers studied the results in aggregate. Looking at the broad distribution of emotions at different times across 12 countries, they were able to determine a “context effect,” a kind of emotional signal, that was shared across artworks produced in the same location and year.
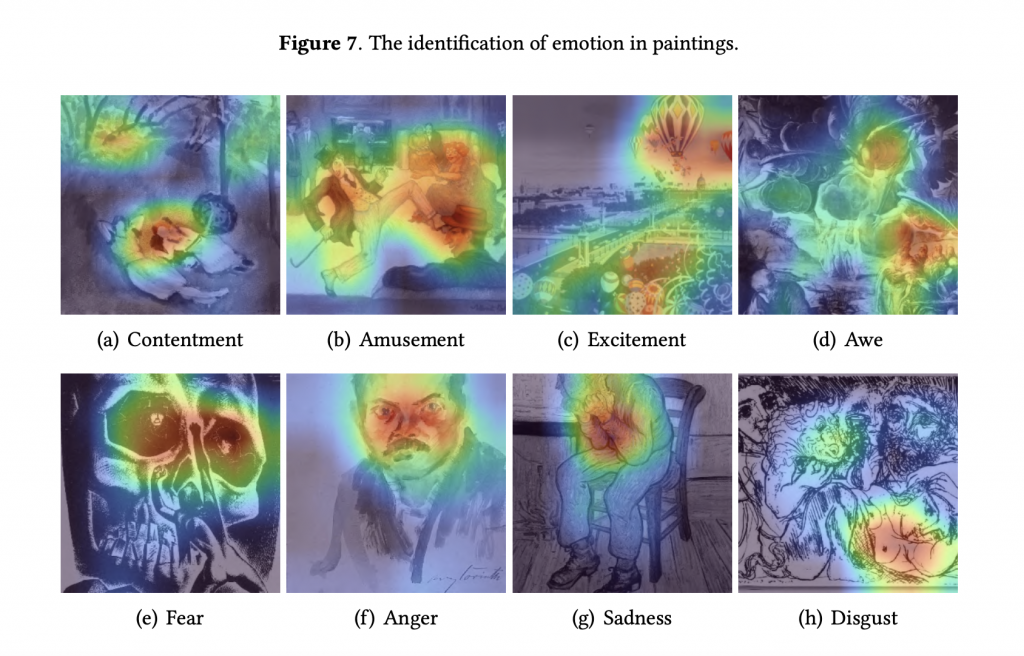
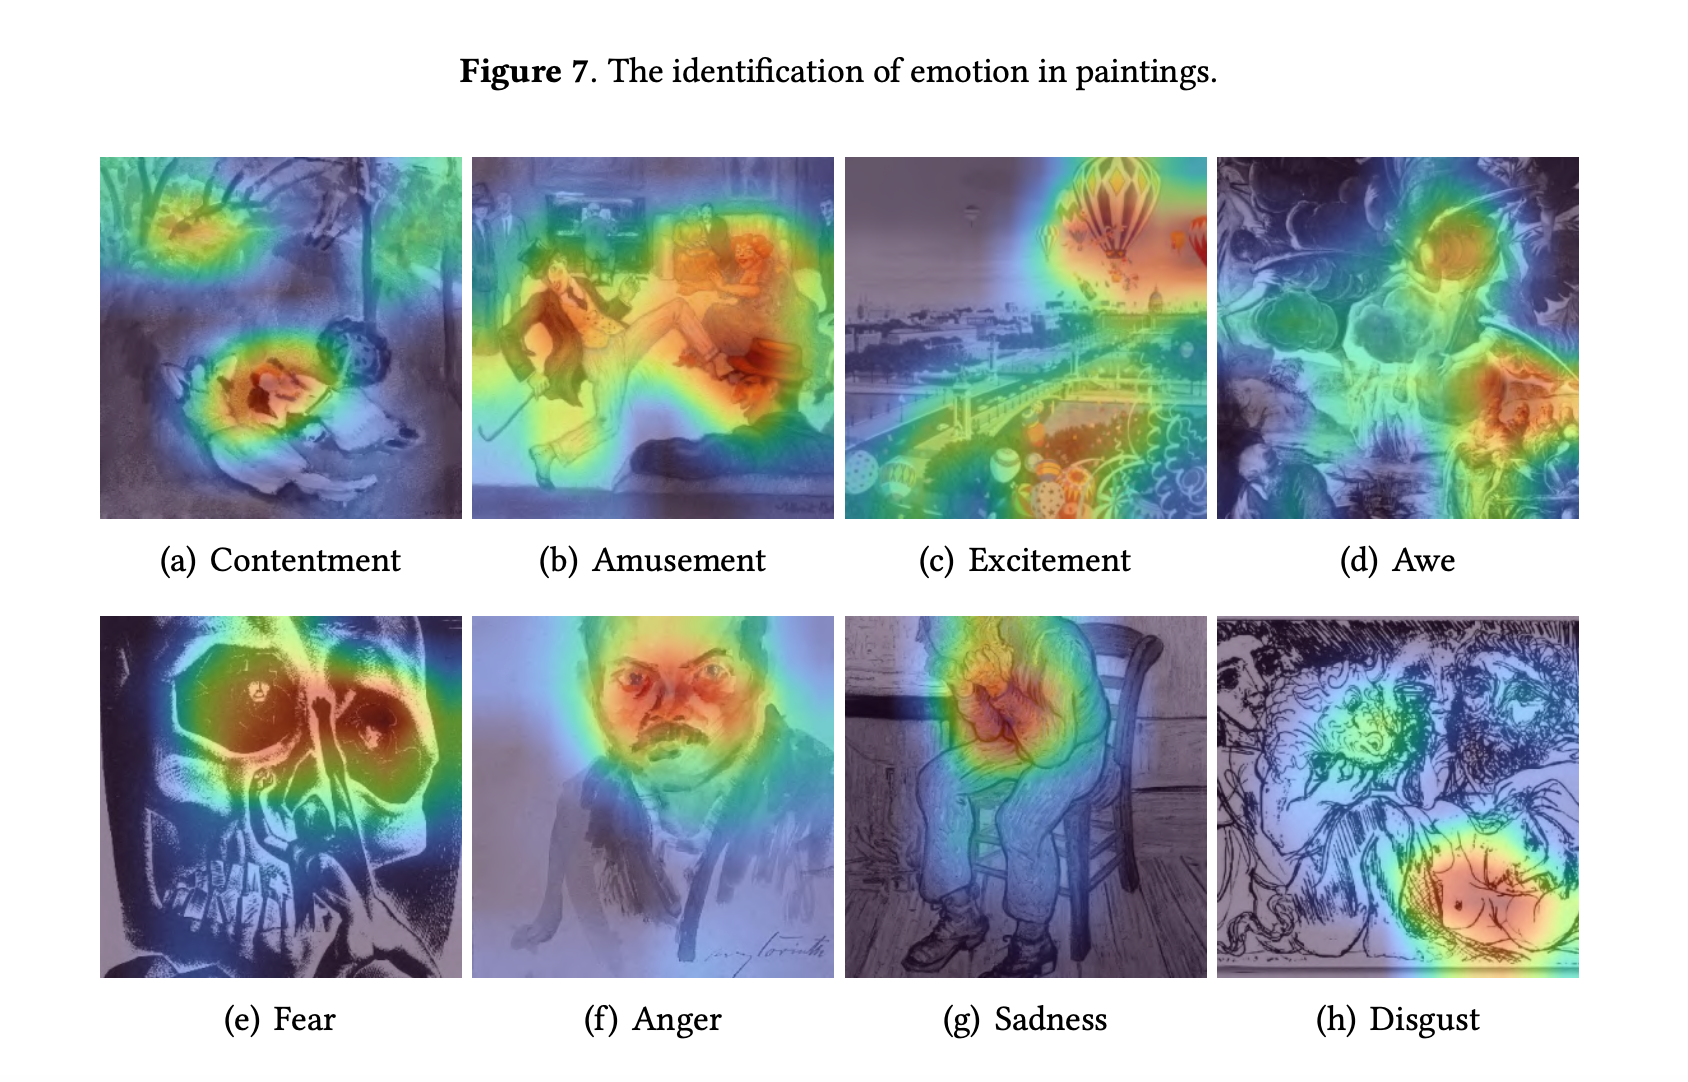
This figure displays heatmaps generated using Class Activation Mapping, which isolates the parts of the image most used by the network to predict a latent emotional probability.
For example, depictions of fear apparently increased during times of social and economic turbulence, while a mood of contentment reigned during times of greater stability. Times of hardship were also correlated with a higher incidence of sadness but amusement or excitement increased again when living standards improved. These differences were exaggerated in paintings of subjects from lower socio-economic backgrounds who are more vulnerable to these wider changes.
The wealth of data even allowed the researchers to analyze localized responses to specific historical events, which might include political shifts, natural disasters, food insecurity, the development of new trade networks, changing belief systems, and key technological changes. In one case study, the researchers compared two major inventions from the 19th and early 20th centuries—the steamship and the radio—spread through society and how people reacted to them.
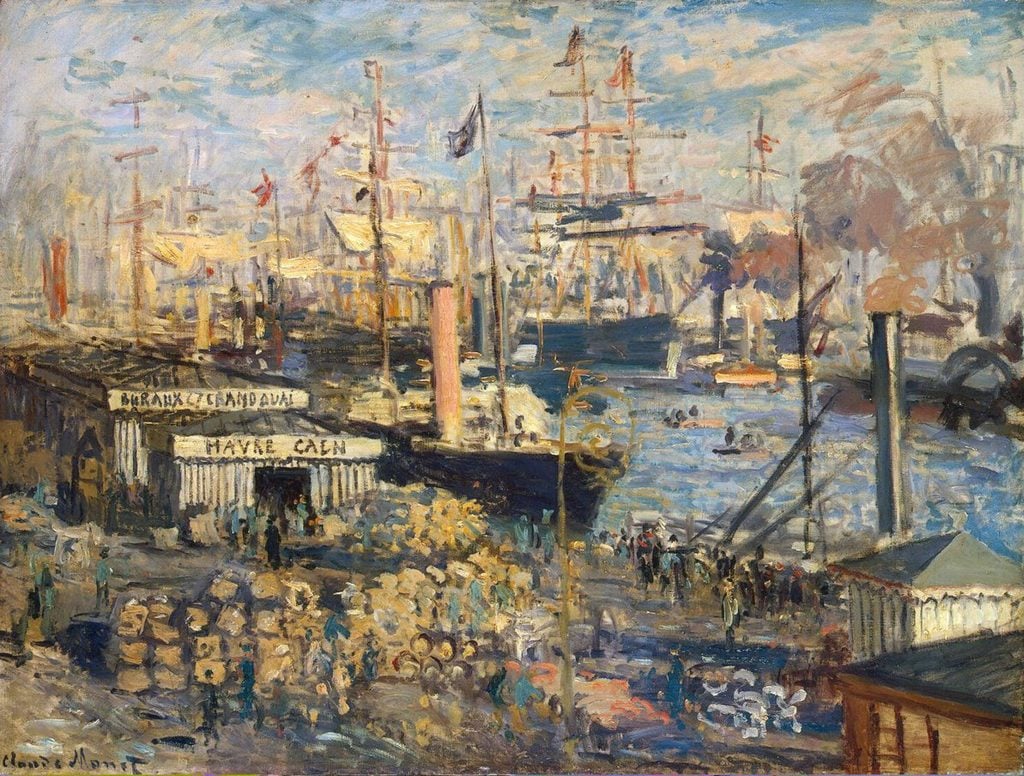
Claude Monet, Grand Quai at Havre (1872). Found in the collection of the State Hermitage, St. Petersburg. Photo: Fine Art Images/Heritage Images/Getty Images.
As U.S. steamship cargo increased during the 1830s, there was a correlation with increased expressions of awe in art. While disagreement declines following steamship adoption, it rises sharply in the case of radio. Although the period measured for radio’s influence, 1900 to 1950, also contained two world wars, the researchers explained that their analysis controlled for these kind of larger, aggregate shocks. Rather, the effect is identified from differential rates of radio adoption across countries. Consumer data charting the spread of radios corresponds to increased depictions of extreme emotions, such as anger, disgust, and excitement at the expense of contentment. “That being said, the effect of the radio could be partly driven by its usage in some countries, like France and Germany, prior to World War II,” said Zylberberg, noting a rise in extremist discourse in the 1930s.
Given its focus on figuative European painting, the study doesn’t account for some countercultural or avant-garde artistic inclinations that birthed movements such as Abstract Expressionism. As more museums digitize their collections, however, this kind of research could expand to cover more movements, regions outside Europe, and lesser-known artists, the economists said. Future studies might even zoom in more precisely on important variations in artistic expression, since artists’ experiences often differed based on their social class, gender, religion, or ethnicity—dimensions that would be important to better understand the geography and dynamics of economic inequality.
Source: https://news.artnet.com/art-world/ai-economic-data-art-2681521